This web page was produced as an assignment for Genetics 564, an undergraduate capstone course at UW-Madison.
What is phylogeny?
Phylogenetics is the study of evolutionary relationships between species [1]. These evolutionary relationships are determined through phylogenetic methods using evolutionary models to evaluate common gene and protein sequences in different species [2]. Phylogenetics is a powerful tool as it can be used to identify genes in newly sequenced genomes, understand how genes and their functions evolve as well as reconstruct ancestral genomes [3]. Evolutionary relationships obtained from phylogenetic analysis are often depicted as phylogenetic trees.
A phylogenetic tree consists of nodes being connected by branches [3]. The nodes represent taxonomic units, such as species, populations, genes, or protein whereas the branches represent the path of transmission of genetic information through time [2,3]. Tips are the end of the tree and occur only on single terminal branches. The root is the most recent common ancestor (MRCA) of all sequences in a phylogeny and tips of the branches represent the descendants of that ancestor [2]. A clade is a group of two or more taxa that includes both their common ancestor and all of their descendants.
A phylogenetic tree consists of nodes being connected by branches [3]. The nodes represent taxonomic units, such as species, populations, genes, or protein whereas the branches represent the path of transmission of genetic information through time [2,3]. Tips are the end of the tree and occur only on single terminal branches. The root is the most recent common ancestor (MRCA) of all sequences in a phylogeny and tips of the branches represent the descendants of that ancestor [2]. A clade is a group of two or more taxa that includes both their common ancestor and all of their descendants.
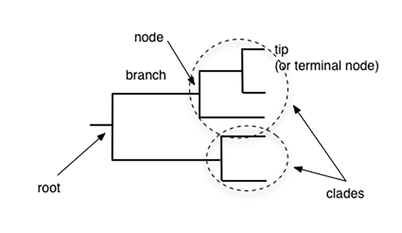
Fig.1. shows an phylogenetic tree annotated with its major components.
Building a Phylogenetic Tree
STEP 1
Obtain homologous amino acid sequences from species of interest and compile them in a FASTA format in a text file.
Sources for sequences include: ENSEMBL, NCBI, UniProt, GenBank, etc.
Obtain homologous amino acid sequences from species of interest and compile them in a FASTA format in a text file.
Sources for sequences include: ENSEMBL, NCBI, UniProt, GenBank, etc.

STEP 2
Align the compiled sequences using a sequence alignment tool. Alignment of sequences is an important step in constructing a reliable phylogenetic tree because multiple sequence alignment identifies blocks of conserved amino acid residues.
Sequence alignment tools: MEGA, MUSCLE, CLUSTALW2, T-COFFEE, etc.
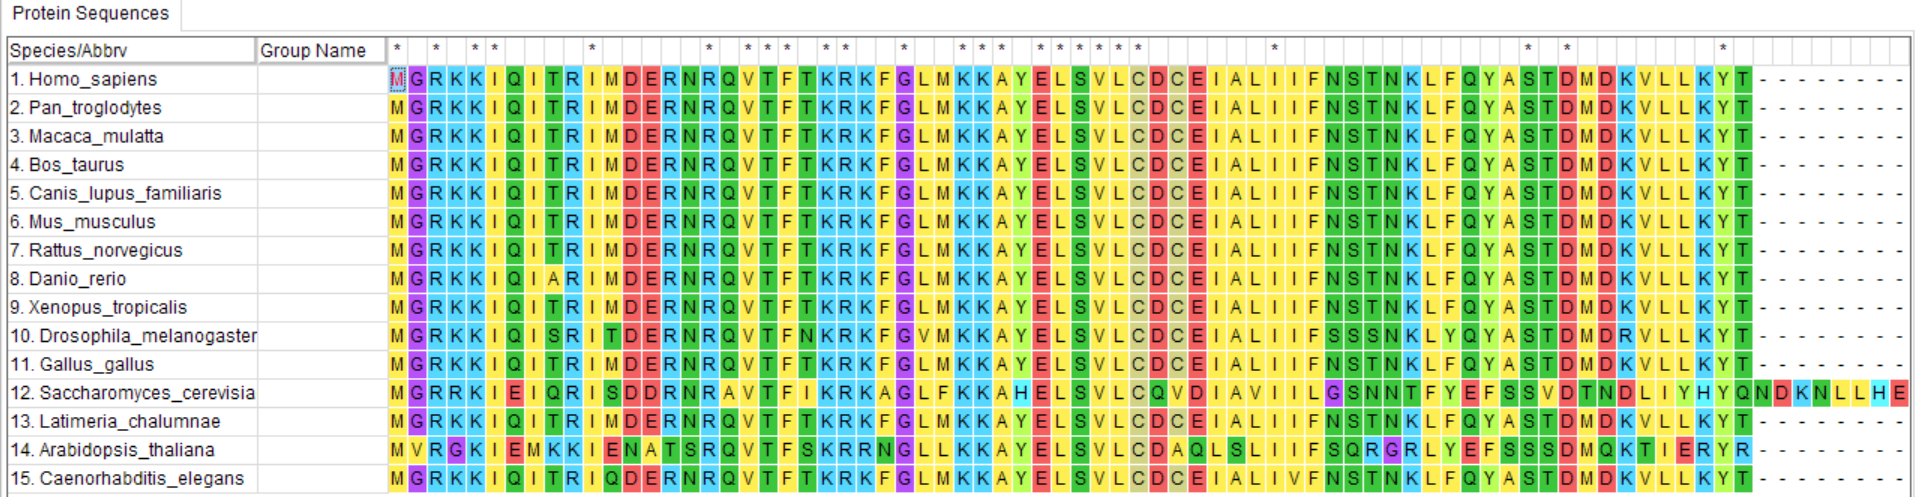
Fig.2: Sequence alignment of MEF2C protein sequence using MEGA7.

STEP 3
Pick a phylogenetic inference method to construct a phylogenetic tree based on the aligned sequences.
Tree building tools: CLUSTAL OMEGA, MEGA, MUSCLE, etc
Phylogenetic Inference Methods
There are three major methods that can be used to infer phylogenetic relationships when constructing a phylogenetic tree. These methods are the Maximum Likelihood, Neighbor Joining and Average Distance methods. The Maximum Likelihood method is a character-based method whereas the Neighbor Joining and Average Distance methods are distance-based methods. In distance-based methods, the distance between every pair of sequence is calculated and the resulting distance matrix is used for tree reconstruction. Character-based methods simultaneously compare all sequences in an alignment, considering one site in the alignment at a time to calculate a score for each tree. The tree with the best score is chosen [3].
Maximum Likelihood
With this method, an initial tree is built using a quick and suboptimal and method and subsequent adjustments are made in its branch lengths to maximize the likelihood of the data set for that tree topology under a certain evolutionary model. Optimized branch lengths are used to calculate the tree score for each candidate tree and to search for the maximum likelihood tree.
Neighbour Joining
This method takes the similarity scores generated based on percent identity or similarity of sequences and uses these scores to determine the relationships between different species. In each stage, the two nearest nodes of the tree are chosen and defined as ‘neighbours’ in a tree and branch length is calculated [1]. This is done recursively until all nodes are paired together to form a tree.
Average Distance
Once again, similarity scores are calculated and used to determine which species are the most closely related but branches are of equal length. This assumes that both species have diverged equally from the common ancestor.
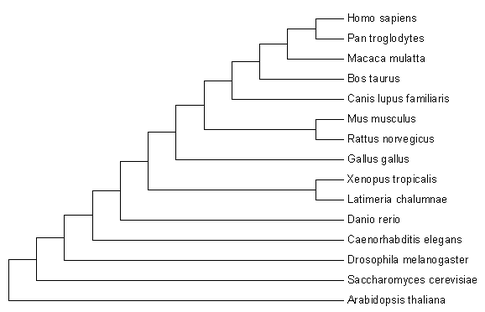
Fig. 2. shows a phylogenetic tree constructed using the Neighborhood Joining method for the MEF2C gene.
Discussion
Phylogenetic analysis of proteins is a useful way of analyzing the homology of MEF2C gene in different species. The phylogenetic tree generated shows how similar a protein sequence is among species across different phyla. Different phylogenetic inference methods may result in different trees, depending on the algorithm model used to calculate relationships between the different proteins. Interestingly, Xenopus tropicalis and Latimeria Chalumnae are more identical compared to Latimeria Chalumnae and Danio Rerio although the latter two are both fish. This is most probably due to a duplication event of MEF2C in the teleost fish [4] belonging to the actinopterygii group, that diverged from the sarcopterygii group, which eventually evolved into vertebrates. Since Danio Rerio is a teleost fish and Latimeria Chalumnae is in the sarcopterygii group, the further distance apart between these two 'fishes' in the phylogenetic tree makes sense. MEF2C exists as two orthologues in zebrafish, MEF2CA and MEF2CB. Previous studies have shown that MEF2CB is highly expressed in the brain compared to MEF2CA and overexpression of MEF2CB results in dramatic failure of brain morphogenesis [4]. Hence, my studies will focus on the MEF2CB ortholog in zebrafish.
References:
[1] Choudhuri, Supratim. (2014) Bioinformatics for Beginners: Genes, Genomes, Molecular Evolution, Databases and Analytical Tools. Chapter 9. MA. Academic Press.
[2] https://www.ebi.ac.uk/training/online/course/introduction-phylogenetics/what-phylogenetics
[3] Yang, Z., & Rannala, B. (2012). Molecular phylogenetics: principles and practice. Nature Reviews Genetics, 13(5), 303.
[4] Adrião, A., Conceição, N., & Cancela, M. L. (2016). MEF2C orthologues from zebrafish: Evolution, expression and promoter regulation. Archives of biochemistry and biophysics, 591, 43-56.
Images:
Header: http://disneyandmore.blogspot.com/2016/05/wdw-announces-opening-dates-for-frozen.html
