This web page was produced as an assignment for Genetics 564, an undergraduate capstone course at UW-Madison.
What is a transcriptome?
Genomes consist of DNA sequences that have to be transcribed into RNA to be able to be read by a ribosome to produce proteins. There are many types of RNA but messenger RNA (mRNA) is a major form of RNA that is essential for the production of proteins for normal cell function [1]. A transcriptome is the full range of mRNA, molecules expressed by an organism [2]. Different cells show different levels of gene expression and regulation despite having the same genes. Hence, analyzing the transcriptome allows us to understand how a cell normally functions and how changes in the normal level of gene activity may result in phenotypic abnormalities [1].

Fig.1: Central dogma of biology showing how genes encode for proteins.
How do we analyze transcriptomes?
|
Microarrays are a tool that can be used to measure the expression of thousands of genes at the same time to provide gene expression profiles. DNA microarrays are slides that are printed with many tiny spots in defined positions. Each spot contains a unique DNA sequence that represents one gene [3]. These sequences act as probes to detect gene expression as messenger RNA (mRNA) transcripts being expressed are identified and measured [2].
|
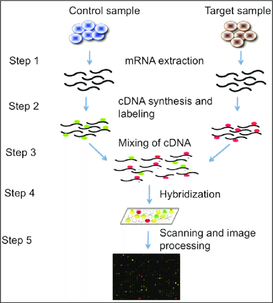
Fig 2: Layout of DNA microarray analysis technique.
|
How can transcriptomics be used to analyze MEF2C expression?
Transcriptomics can be used to understand the role of MEF2C as a transcription factor on its downstream targets related to neuronal development. The Human Protein Atlas shows that MEF2C RNA is highly expressed in the cerebral cortex as well as in muscle tissue. Hence, transcriptomic analysis for my aims will focus on neuron cells found in the cerebral cortex.
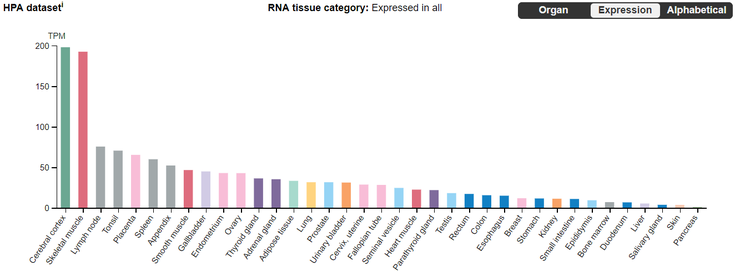
Fig.3: MEF2C RNA expression in different human tissues.
Discussion
Being interested in phosphorylation sites involved in MEF2C activation, I plan on conducting a mutation of conserved phosphorylation sites in MEF2C as described in Aim 2 of my Specific Aims. I then plan on using microarray analysis on the transcriptome of wildtype neuron cells and mutant neuron cells to identify differentially expressed genes (DEGs), which might be downstream targets regulated by MEF2C. These DEGs might reveal how phosphorylation sites are important in regulating neuronal development imbalance, causing depression. In addition, there are no GEO datasets for MEF2C expression in the brain on Gene Expression Omnibus. Hence, this analysis will be very useful in understanding the various roles of MEF2C in relation to the regulation of synaptic density in more detail.
References:
[1] https://www.genome.gov/10000533/dna-microarray-technology/
[2] https://www.genome.gov/13014330/
[3] https://www.nature.com/scitable/definition/microarray-202
Images:
Header: https://exploreable.wordpress.com/2011/04/page/2/
Figure 1: https://www.khanacademy.org/science/biology/gene-expression-central-dogma/central-dogma-transcription/a/intro-to-gene-expression-central-dogma
Figure 2: https://www.researchgate.net/figure/Outline-of-different-Steps-of-a-Microarray-Experiment_fig2_313277390
Figure 3: https://www.proteinatlas.org/ENSG00000081189-MEF2C/tissue
